Email Campaign Performance Dashboard Automation
Reduce manual reporting time by 95% with automated campaign metrics exports.
Marketing teams waste hours pulling campaign stats and audience health data from separate screens. This workflow pulls sent-campaign metrics and list stats, merges them, and writes ready-to-use rows into Google Sheets for dashboards. Result: timely, accurate campaign performance reports and faster decisions with near-zero manual effort.
Documentation
Description
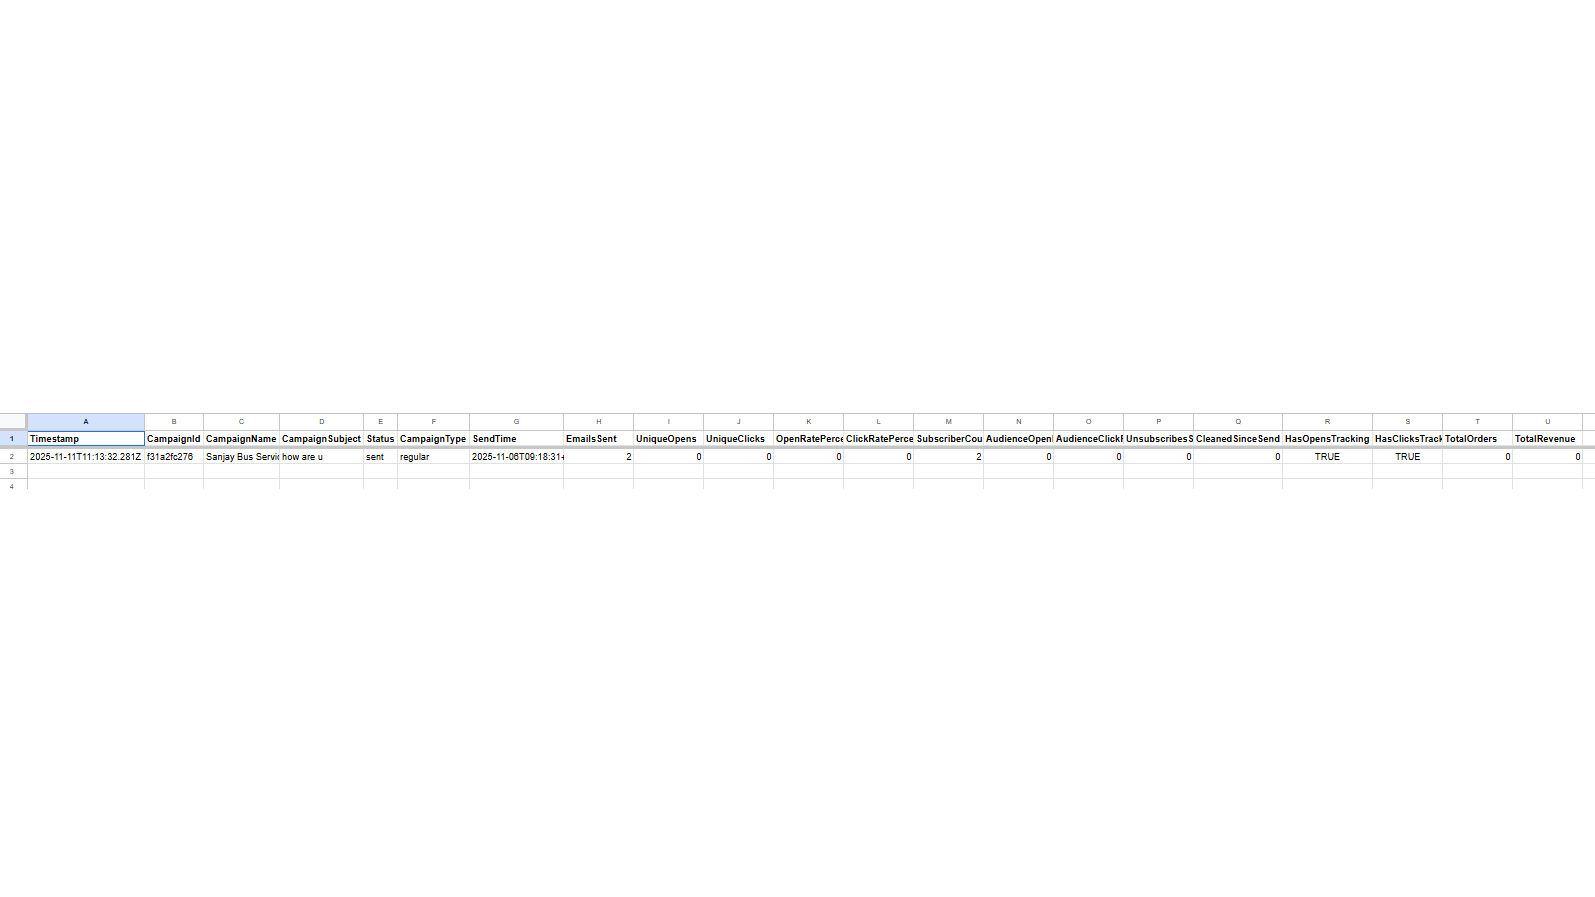
This automation collects all sent Mailchimp campaigns from the past 30 days, merges them with audience-level performance stats, and structures the data into a clean analytics-ready format. It then appends each campaign row into Google Sheets, updating your dashboard automatically. Marketers gain instant visibility on open rates, click rates, unsubscribes, orders, and revenue—without any manual exports or spreadsheet cleanup.
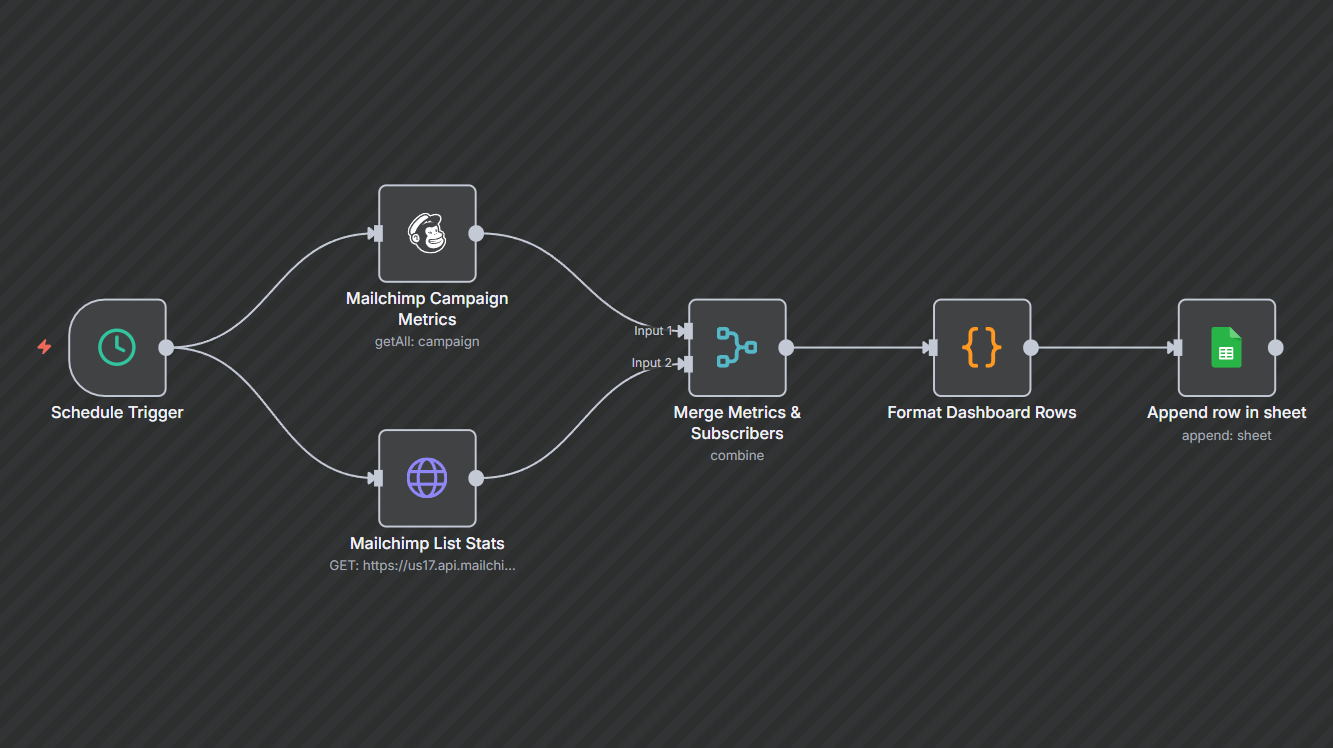
Workflow Steps
1. Schedule Trigger
Runs automatically on your chosen schedule (recommended: daily or weekly).
2. Fetch Campaign Metrics
Loads the latest 30-day Mailchimp campaigns including opens, clicks, send time, and ecommerce stats.
3. Fetch Audience Stats
Pulls list-level performance indicators such as subscriber count, audience open rate, and click rate.
4. Merge Campaign + Audience Data
Combines both datasets into a single row for accurate reporting.
5. Format Dashboard Rows
Cleans, normalizes, and converts all values (percentages, timestamps, tracking flags, ecommerce metrics).
6. Append to Google Sheets
Automatically updates your dashboard with fresh rows—no manual exports needed.
Key Benefits
Save hours weekly
No more exporting CSV files or updating spreadsheets manually.
Cleaner insights
Standardized data ensures clear trends and accurate comparisons across campaigns.
Smarter decisions
Easily track performance metrics like open rate, click rate, unsubscribes, total orders, and revenue.