Automate Data Visualization from SQL with AI for Faster Insights
Generate dynamic data visualizations from complex SQL queries in seconds, accelerating data analysis and reporting by over 90%.
Manually querying databases and creating data visualizations is a time-consuming and technically demanding process for business users. This workflow automates database queries with an AI agent and dynamically generates interactive charts, providing instant, actionable insights without manual effort.
Documentation
AI SQL Agent with Dynamic Chart Generation
This n8n workflow enhances a native SQL Agent with powerful AI-driven data visualization capabilities. It enables business users to effortlessly query databases and receive not just answers, but also supporting charts, fostering deeper data analysis and collaboration within teams.
Key Features
- Intelligent SQL Querying: An AI agent interprets natural language questions, translates them into SQL queries, and fetches data from your database.
- Automated Chart Generation: Automatically determines if a chart would enhance the data, then dynamically creates relevant visualizations using OpenAI's structured output.
- Conversational Interface: Interact with your data through a simple chat interface, making data analysis accessible to non-technical users.
- Flexible Data Sources: Connects easily to PostgreSQL, MySQL, or SQLite databases.
- Instant Visual Insights: Converts raw data into clear, shareable charts via Quickchart.io, appended directly to the AI's response.
How It Works
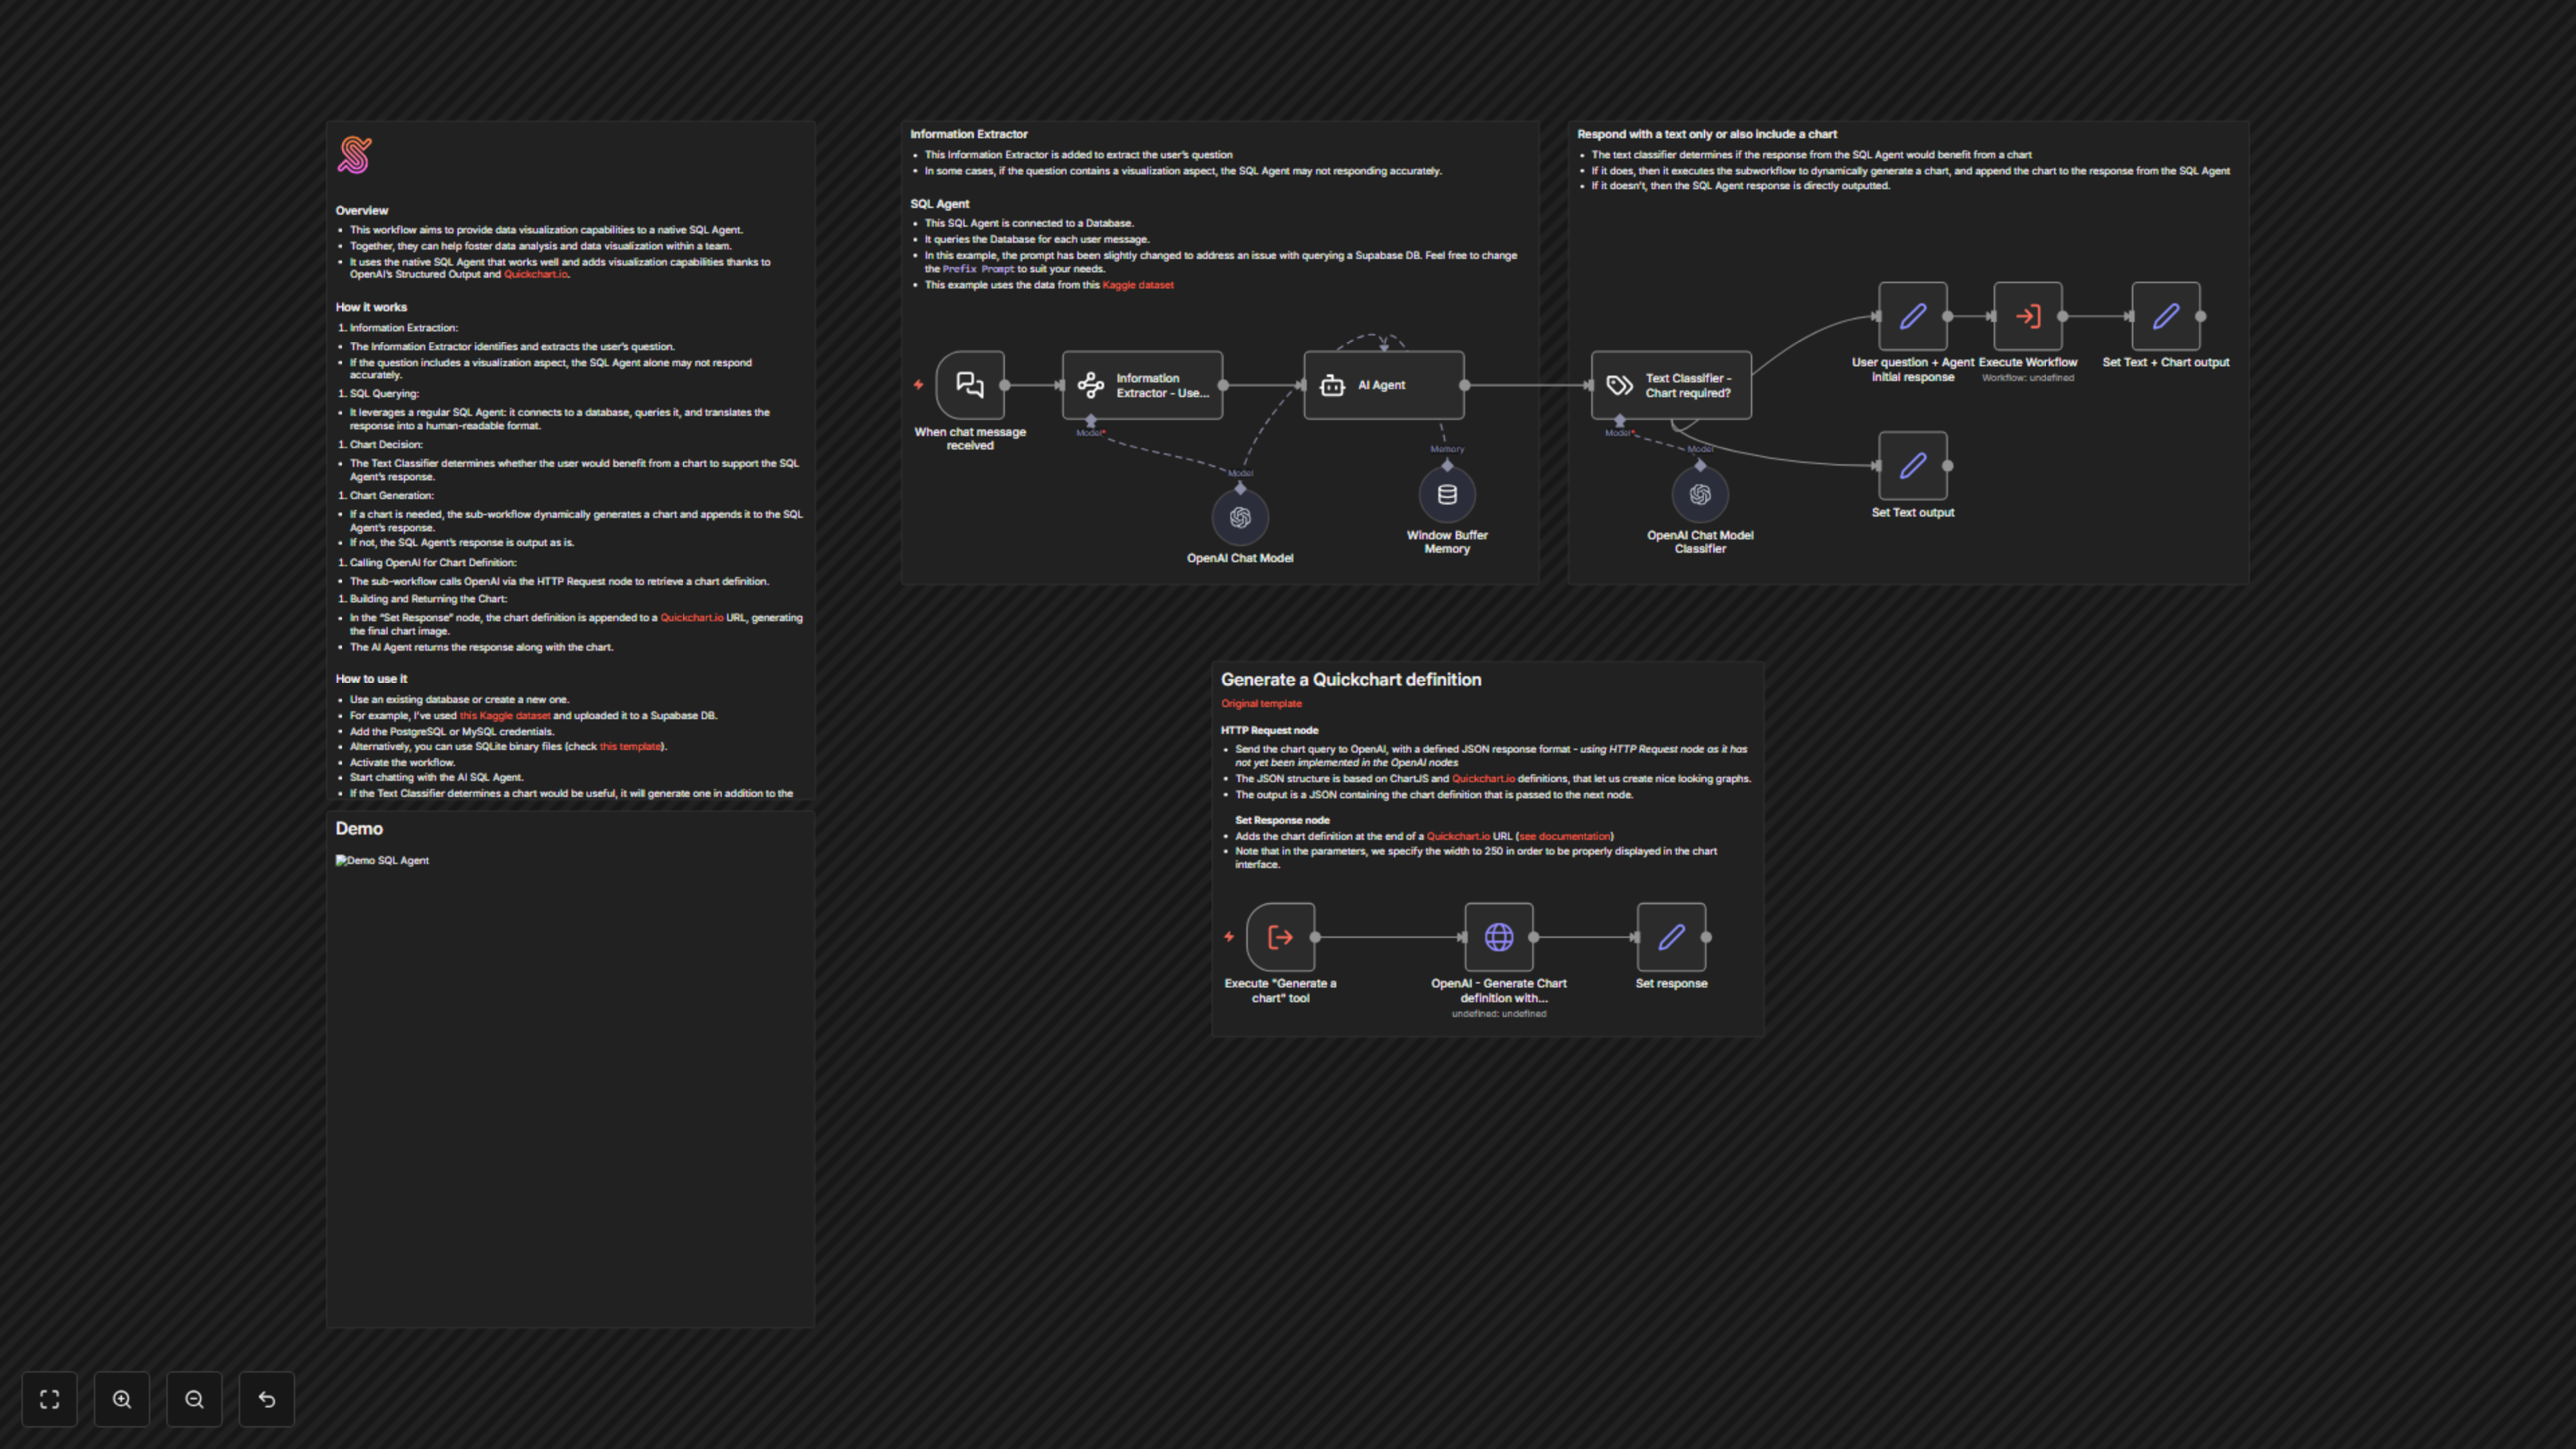
1. User Request: The workflow is triggered by a chat message (via the When chat message received node) containing a user's data question.
2. Information Extraction: An Information Extractor node uses AI to precisely identify and extract the core question from the user's input, filtering out any chart-specific requests initially.
3. SQL Query & Response: The AI Agent (SQL Agent) connects to your configured database, generates and executes an SQL query based on the extracted question, and processes the results into a human-readable answer. This agent leverages OpenAI's language model and a Window Buffer Memory for contextual conversations.
4. Chart Decision: A Text Classifier node, powered by another OpenAI model, analyzes both the original user request and the SQL Agent's response. It intelligently decides whether a visual chart would significantly improve the user's understanding of the data.
5. Conditional Output: The workflow branches based on the classifier's decision:
- Text-Only Response: If a chart is deemed unnecessary, the SQL Agent's textual response is directly outputted via the Set Text output node.
- Text + Chart Response: If a chart is beneficial, the user's question and the SQL Agent's initial response are passed to an internal chart generation process (triggered by the Execute Workflow node calling itself). This process handles dynamic chart creation.
6. Chart Definition Generation: The workflow calls OpenAI via an HTTP Request node (specifically, OpenAI - Generate Chart definition with Structured Output). It provides the user's question and the SQL Agent's raw data. OpenAI, guided by a strict JSON schema (based on Chart.js and Quickchart.io definitions), generates a precise chart configuration in JSON format.
7. Chart Image Creation: The Set response node takes the generated chart definition and embeds it into a Quickchart.io URL, which then renders a high-quality chart image.
8. Final Output: The AI Agent's textual response is combined with the generated chart image (via the Set Text + Chart output node), presented together for comprehensive data insight.