Enhance AI Conversations with Auto-Generated Charts
Deliver real-time visual insights within AI conversations, eliminating manual chart creation and enhancing user engagement by integrating dynamic charts instantly.
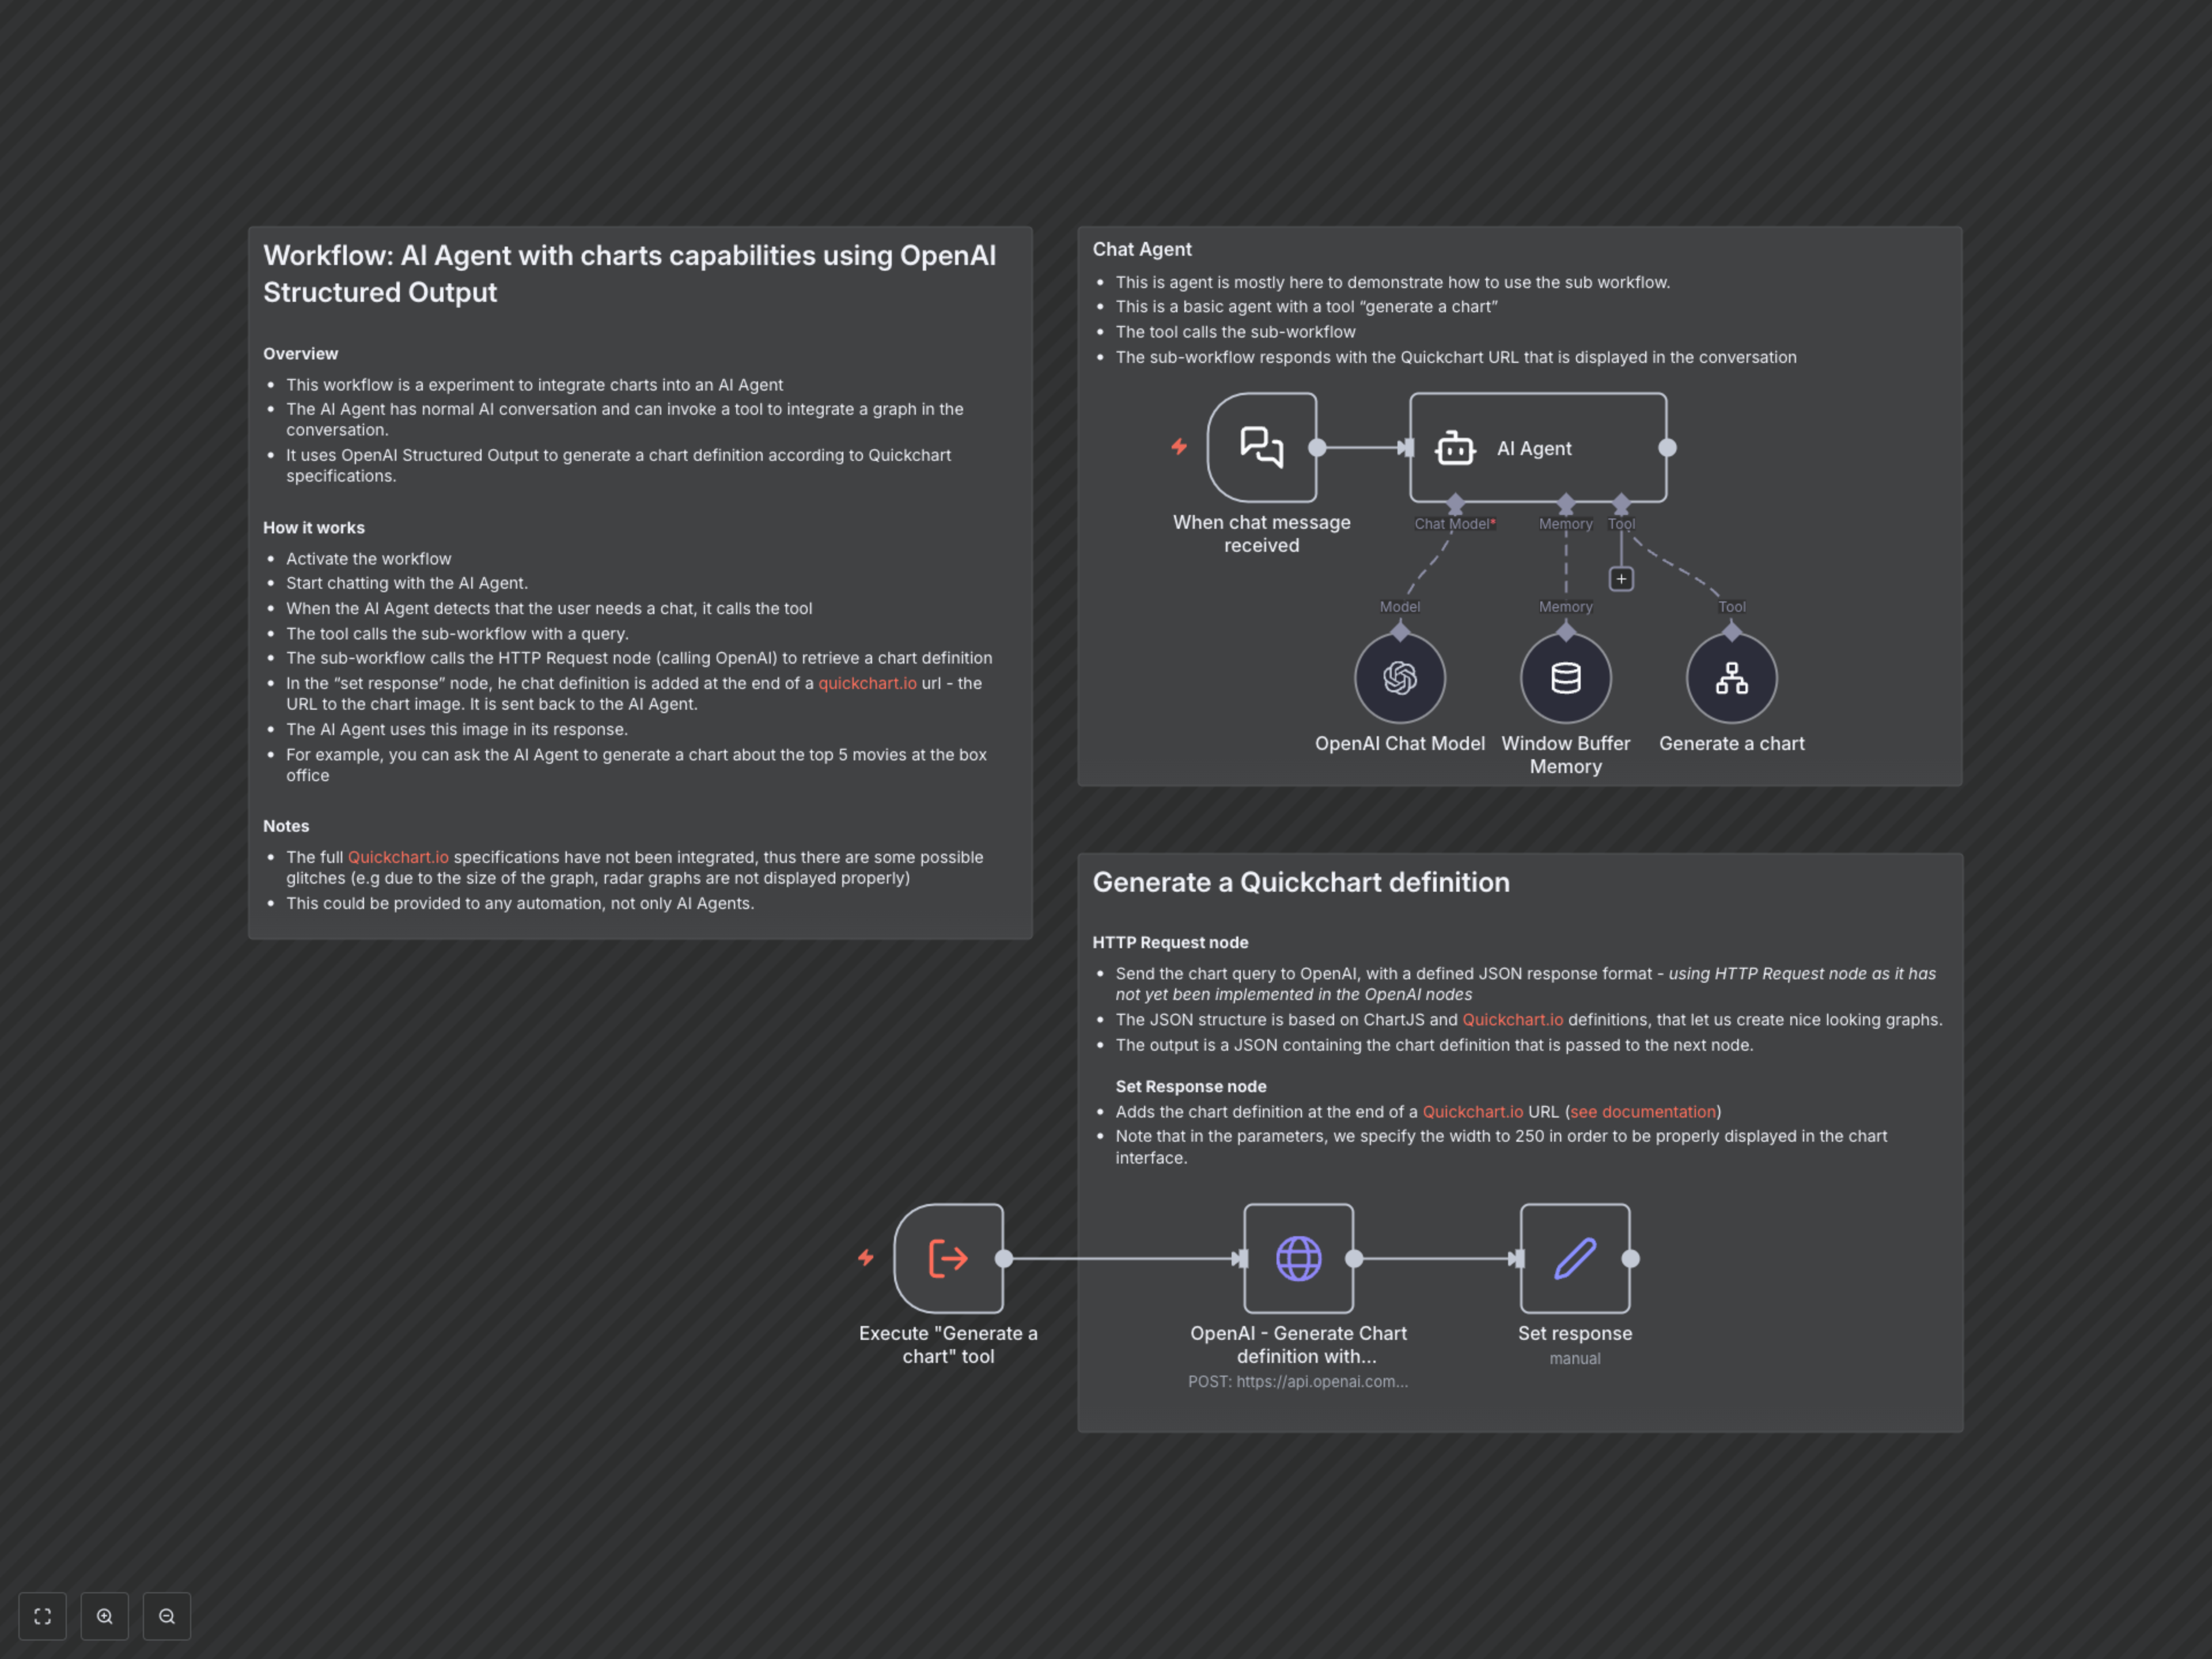
Integrating dynamic, data-rich visualizations into AI conversations is often complex and manual, hindering real-time insights. This workflow empowers an AI Agent to interpret user queries, automatically generate precise chart definitions using OpenAI's structured output, and display interactive charts instantly.
Documentation
AI Agent with Dynamic Charting Capabilities
This n8n workflow demonstrates how to integrate dynamic chart generation into an AI Agent's conversation flow. It's ideal for developers and businesses looking to enrich AI interactions with real-time visual data, moving beyond text-only responses.
Key Features
- AI-powered chart generation directly from natural language queries.
- Utilizes OpenAI's Structured Output to generate precise Chart.js definitions.
- Seamless integration of Quickchart.io to render visual data as image URLs.
- Enhances AI Agent conversations with rich, interactive data visualizations.
How It Works
This workflow operates as a sophisticated AI Agent capable of both conversational interaction and dynamic chart generation. When a user sends a chat message, the AI Agent (powered by an OpenAI chat model and memory) interprets the request. If the agent detects a need for data visualization (e.g., "Show me a bar chart of sales"), it intelligently invokes a designated tool: "Generate a chart". This tool triggers a sub-workflow, passing the user's chart query. The sub-workflow then makes an HTTP request to OpenAI, providing a strict JSON schema for Chart.js definitions. OpenAI returns a valid JSON chart configuration, which is subsequently embedded into a Quickchart.io URL. This URL, representing the chart image, is returned to the main AI Agent, which incorporates and displays the visual data within its conversational response.