Automate Medoid & Threshold Setup for Qdrant Anomaly Detection
Automate the complex setup of anomaly detection medoids and thresholds, cutting model preparation time by up to 90% and enhancing detection accuracy.
Manually defining anomaly detection parameters like cluster centers (medoids) and thresholds for large datasets is time-consuming and prone to error. This n8n workflow automates the identification and setup of two types of medoids and their corresponding anomaly detection thresholds within a Qdrant vector database, streamlining AI model preparation.
Documentation
Automate Medoid & Threshold Setup for Qdrant Anomaly Detection
This n8n workflow is the second step in a three-part series designed to set up a robust anomaly detection system for image datasets, specifically using agricultural crops as an example. It automatically establishes 'medoids' (representative cluster centers) and calculates crucial anomaly threshold scores within your Qdrant vector database, leveraging two distinct, powerful approaches to ensure comprehensive data understanding and preparation for anomaly detection.
Key Features
- Automated Medoid Identification via Distance Matrix: Efficiently calculates pairwise distances within clusters using Qdrant's Distance Matrix API and Scipy to pinpoint the most representative point (medoid) for each crop type.
- AI-Powered Medoid Selection using Multimodal Embeddings: Utilizes Voyage AI to embed textual crop descriptions and then searches Qdrant to find the image most semantically similar to establish a second type of medoid.
- Dynamic Anomaly Threshold Calculation: Automatically determines a cluster-specific threshold score for anomaly detection by identifying the point furthest from each medoid.
- Seamless Qdrant Integration: Directly interacts with your Qdrant Cloud instance to fetch data, compute distances, and update point payloads with medoid and threshold information.
- Adaptable to Any Image Dataset: Designed for flexibility, this workflow can be easily adapted to process different image datasets, provided they are structured similarly within Qdrant.
How It Works
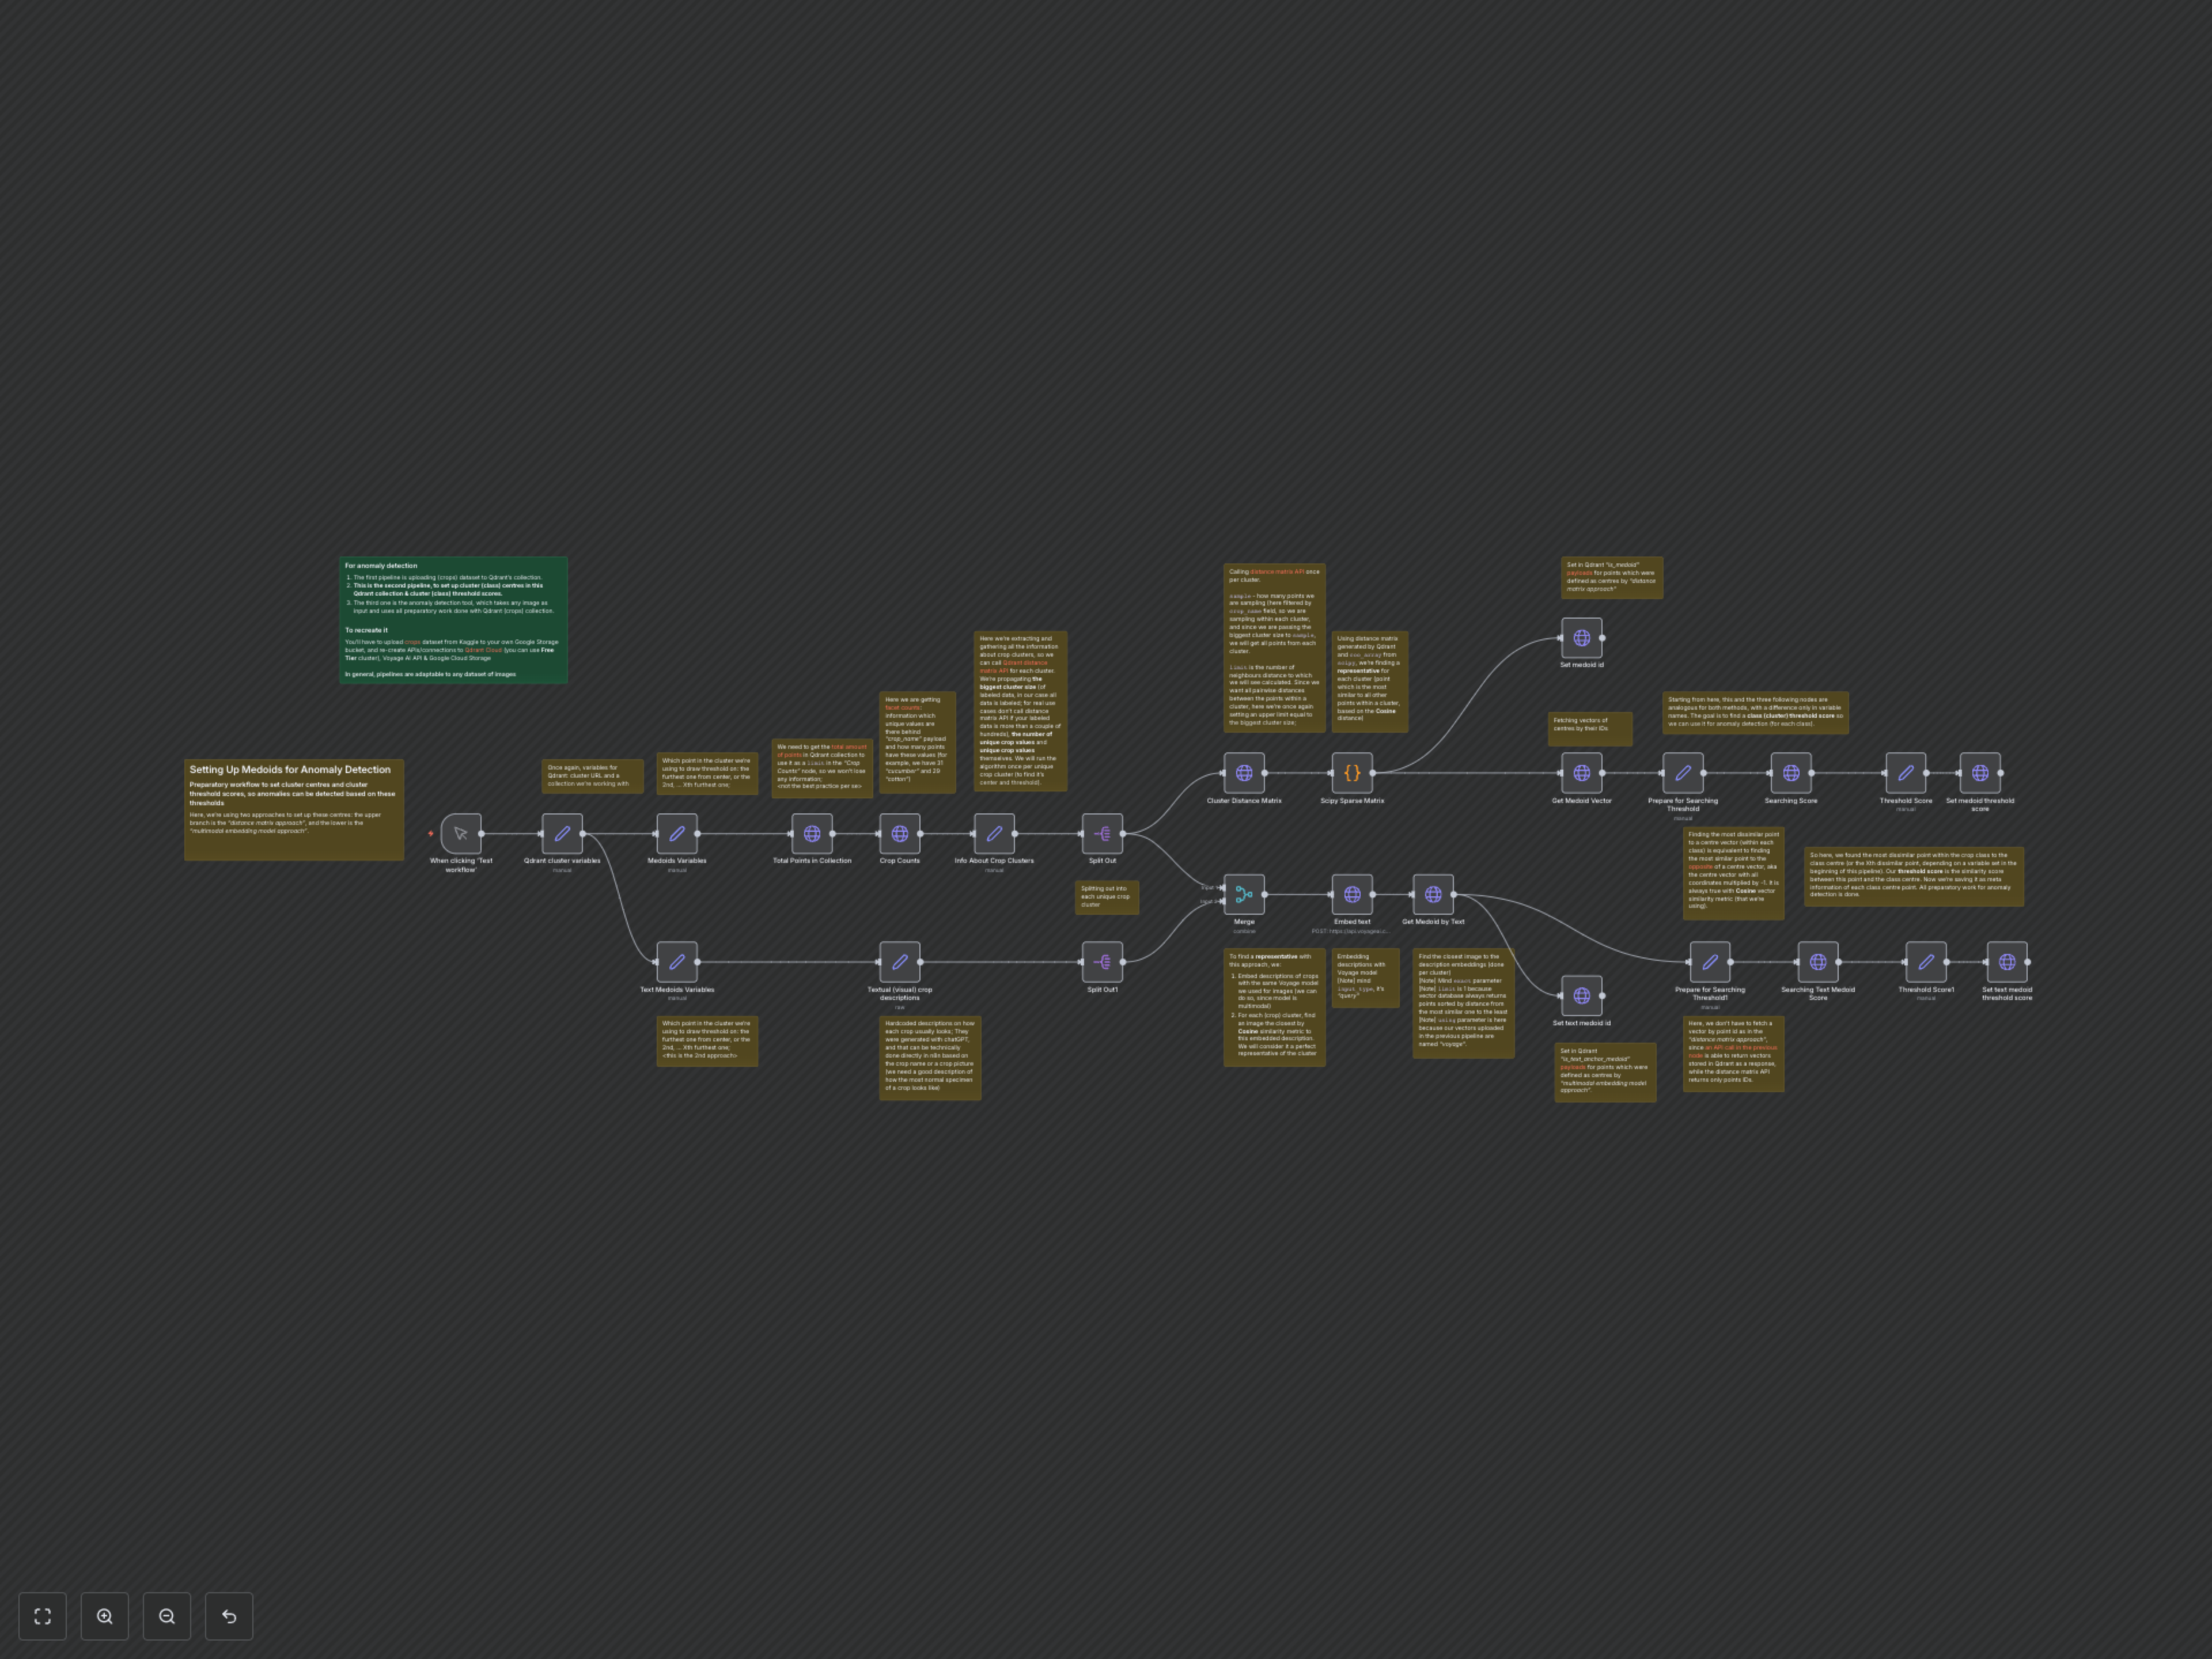
The workflow initiates by retrieving the total number of points and facet counts for 'crop_name' from your Qdrant collection. This information is used to understand the structure of your dataset and iterate through each unique crop cluster. It then proceeds along two parallel branches to establish medoids and thresholds.
The first branch, the 'Distance Matrix Approach', calls Qdrant's distance matrix API for each crop cluster. A Python Code node then processes the returned scores and offsets using `scipy.sparse.coo_array` to identify the point most similar to all others within that cluster, designating it as the medoid. This medoid's ID and vector are then used to calculate its anomaly threshold.
The second branch, the 'Multimodal Embedding Approach', uses hardcoded textual descriptions of each crop. These descriptions are embedded using Voyage AI's multimodal model. The workflow then queries Qdrant to find the image within each crop cluster whose vector is closest to the text embedding, establishing this image as the 'text anchor medoid'. Similar to the first approach, this medoid's vector is then used to determine its specific anomaly threshold.
For both medoid types, the workflow calculates an anomaly threshold score. This is done by finding a point (e.g., the 5th furthest) from the identified medoid within its cluster, by searching for points most similar to the *opposite* of the medoid's vector. The similarity score of this 'furthest' point, multiplied by -1, defines the cluster's anomaly threshold. Finally, Qdrant point payloads are updated with the `is_medoid` and `is_medoid_cluster_threshold` flags and values.